May 6th, 2022 by Nikolay Alexandrov
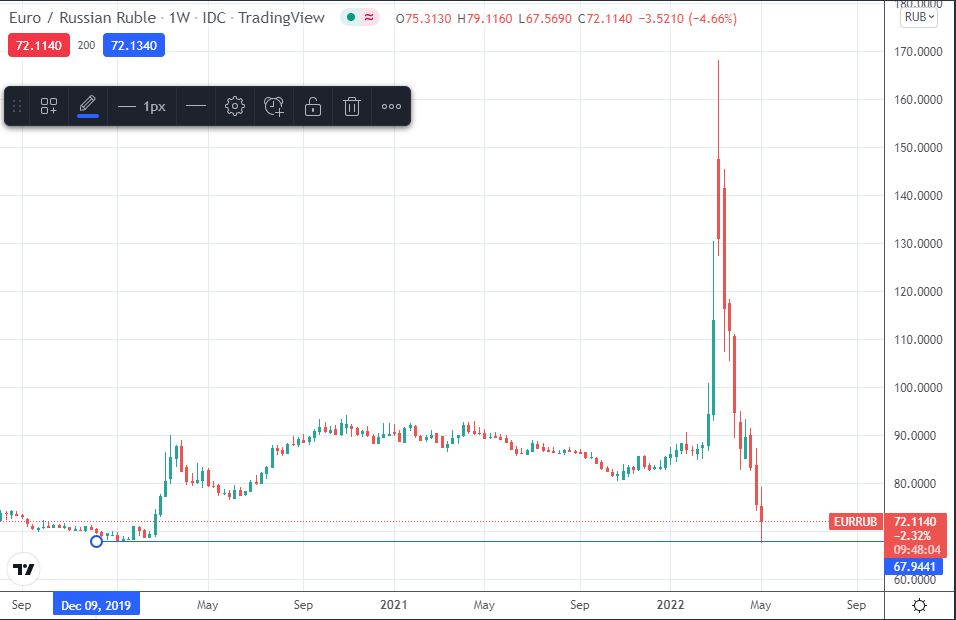
Following the Russian invasion of Ukraine, there was a steady decline of the Russian Ruble against all major currencies. On March 7th, the Ruble hit a new low of about 137 against the US Dollar. Lately it seems oddly enough that the Ruble is back despite the flurry of sanctions imposed by the West against Russia.
On March 31st in response to the piling Western sanctions imposed because of Russia’s invasion of Ukraine, Putin has warned Europe that his country will only accept payments for gas supplies in Rubles or there will be a possible cut in supplies. EU countries rely on Russia for about one-third of the bloc’s total gas supplies.
The European Commission on Thursday April 28th warned countries buying Russian gas they could breach sanctions if they converted gas payments into Rubles, as officials struggled to clarify the EU’s stance on Moscow’s payments scheme, which has sowed confusion in the bloc. To meet its demand, Russia ordered that energy companies from “unfriendly countries” change their gas payments into Rubles at Gazprombank, a request that some in the EU, including Germany, said did not break sanction rules.
The Russian Ruble broke past a more than two-year high against the Euro in the past week before steadying near Monday’s close, in a week where tax payments were supportive of the currency and as investors looked ahead to an expected rate cut last Friday April 29th.
Should the Ruble be strengthening amid all the geopolitical and economic turmoil of the past few months?
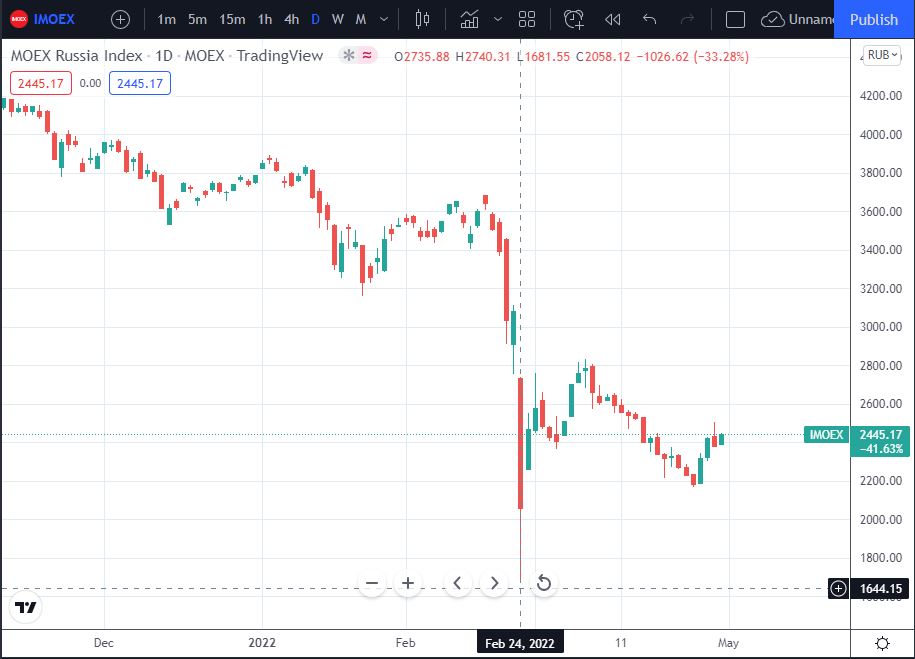
According to some analysts, if one is to take a look under the surface, they would see the strong arm of the Russian state trying to hold the markets stable. The Russian government introduced strict capital controls that have boosted the Ruble, and it has banned foreign investors from ditching domestic assets. Therefore there is a sense that the Ruble strength is artificial and temporary. Moscow’s MOEX stock index has tumbled roughly 40% this year, but it has risen around 9% since bottoming in late February. There is belief that its level should be considerably lower as there are about 900 million Rubles worth of depositary receipts of Russian stocks that could be sold by local investors on MOEX.
On the other hand, it seems that the possibility of cutting gas supplies would critically subdue many EU national economies. With prices for the fuel surging, the uncertainty has also boosted Russian income, while stoking political pressure on European leaders. Already Russia has cut off gas sales to Poland and Bulgaria, two parties that refused to pay in Rubles. Also at stake is European unity, with some countries including Germany more reliant on Russian gas than others. So far, EU’s legal guidelines have left some companies and governments confused.
Another factor to consider is that the Russian Central Bank announced pegging the currency with gold. Any currency backed by gold is perceived to be stabler and stronger. The move is expected to increase already large stockpile of gold into the vaults of the Russian Central Bank. With Russian gold coming under sanctions, the country’s gold stocks both from individuals and banks could be sold to the Central Bank. The value of the Ruble could further increase once the Central Bank’s gold stocks from domestic sources increase, which is expected to happen in the next few months.
According to the website “euractiv.com” Hungary said it plans to pay for Russian gas in Euros through Gazprombank, which will convert the payment into Rubles to meet the new requirement. Greece also said it plans to pay Gazprombank next month in a way that will not breach EU sanctions against Russia.
If payments in Ruble start flowing in, the demand for the currency may continue to increase. The gold flow into the Central Bank may take some time but the impact of Ruble trade for gas purchase will be immediate. Will the West counteract these moves or will Russia gain the upper hand?
Sources
nationalheraldindia.com, rferl.org, euractiv.com, reuters.com, markets.businessinsider.com, bloombergquint.com, nationalheraldindia.com .
*Disclaimer: The information contained in this publication does not constitute investment advice and is not a personal recommendation from Fortissio. Nothing contained herein constitutes the solicitation of the purchase or sale of type of financial instrument. Any investment activities undertaken using this information will be at the sole risk of the relevant investor. Fortissio expressly disclaims all liability for the use or interpretation (whether by visitor or by others) of information contained herein. Decisions based on this information are the sole responsibility of the relevant investor. Any visitor to this page agrees to hold Fortissio and its affiliates and licensors harmless against any claims for damages arising from any decisions that the visitor makes based on such information.
April 21st, 2022 by Nikolay Alexandrov
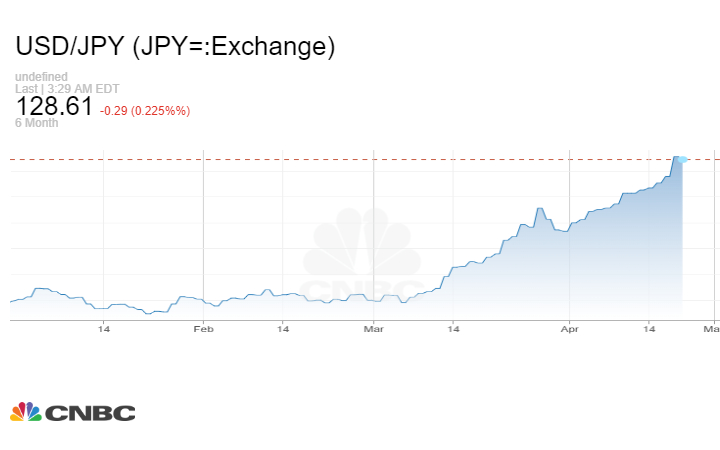
The Japanese yen (JPY) has been experiencing a freefall for the last few weeks amid the country’s dovish monetary policy and central banker’s Kuroda insistence that a weak yen is not harming the economy.
Japan’s top currency diplomat Masato Kanda said a weak yen has both merits and demerits for the economy due to the country’s changing export patterns and increasing reliance on imports.
The weakness of the Yen especially in the 80s and 90s was a cause for celebration for Japanese exporting companies that could sell cars and electronics cheaper in foreign markets and experienced bigger profitability when earnings were brought back home. Around two-thirds of the automobiles produced by Japanese manufacturers are now made abroad, according to Reuters calculations based on data from the “Japan Automobile Manufacturers Association”.
The demerits side according to Kanda is that the weakness in the yen has driven up the cost of fuel and other commodities for manufacturers at home. Additionally, it is also hurting household spending and consumer confidence in the domestic market.
The yen’s solid status was mainly supported based on the fact that Japan has been the world’s largest net creditor and benefited from massive current account surpluses thanks to a flow of income from overseas, including returns on investments. Consequently, the yen has been, and it is still widely accepted as a “safe-haven” currency, meaning that in times of high market uncertainty and elevated risk, foreign exchange investors tend to park their funds towards the yen for safe returns.
However, due to the structural change in Japan’s trade balance, concerns are growing that the country may even post an annual current account deficit. Because of the increasing red ink in the trade arena, Japan posted a current account deficit in December and January. Although February posted a ¥1.64 trillion current account surplus, the figure was still down by 42.5% year on year.
Economists said that the current global economic landscape is vastly different due to the Russia-Ukraine conflict and the ongoing pandemic, which are diminishing some of the benefits of a depreciated yen. Economists also warned that a weakness in the yen is expected to last for some time, as the BOJ appears to be insisting to its dovish stance even though hawkish central banks in other nations are set to raise interest rates to contain inflation.
The manufacturing industry has been experiencing pandemic-related supply constraints, such as those over semiconductors. Major Japanese automakers have been forced to cut production and reduce their exports.
BOJ Governor Haruhiko Kuroda said recently that the yen’s latest moves had been “quite sharp” and could hurt companies’ business plans, offering his strongest warning yet of the risks arising from the currency’s drop. Kuroda, however, repeated his view the BOJ must stay firm to its massive stimulus program to support economic recovery. Nevertheless, the IMF has revised Japan’s 2022 growth forecast to 2.4% from 3.3%. for 2022 warning for “spillover” risks citing the Ukraine war.
If a weak yen is going to persist, the question is: Will the Bank of Japan react to counter the trend? Or will the USD/Yen be left to a freefall beyond ¥130.00?
Sources
capital.com, cnbc.com, reuters.com, japantimes.co.jp.
*Disclaimer: The information contained in this publication does not constitute investment advice and is not a personal recommendation from NaxexInvest. Nothing contained herein constitutes the solicitation of the purchase or sale of type of financial instrument. Any investment activities undertaken using this information will be at the sole risk of the relevant investor. NaxexInvest expressly disclaims all liability for the use or interpretation (whether by visitor or by others) of information contained herein. Decisions based on this information are the sole responsibility of the relevant investor. Any visitor to this page agrees to hold NaxexInvest and its affiliates and licensors harmless against any claims for damages arising from any decisions that the visitor makes based on such information.
April 18th, 2022 by Nikolay Alexandrov
The times we are going through are very challenging for all investors. Everyone is seeking to build solid investment portfolios by employing risk mitigation strategies to navigate through the tough, volatile and turbulent economic environment. One such risk-mitigating method that investors may choose to employ, is the long-short strategy. Many funds today employ this strategy not only to amplify their returns but also to achieve uncorrelated performance in any market condition.
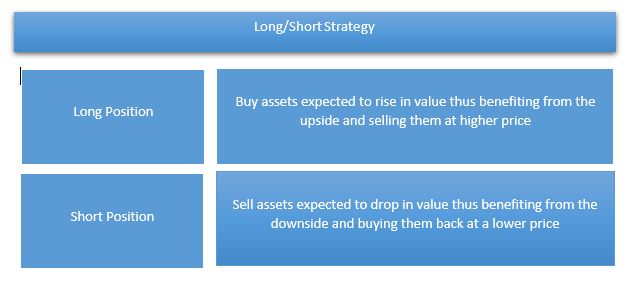
The long-short strategy involves the simultaneous purchase of assets (“long”) that are expected to rise in value and at the same time the short-selling of assets (“short”) that are expected to drop in value or not perform as well – on a relative basis compared with the long position. This practice can be employed over any investment time horizon. With both long and short positions, investors can potentially benefit both from a bull market as well as a bear market. The choice of what to long or short can be taken within the same sector, or long and short positions can be a combination of inversely related sectors.
A real-world simplified example of using this strategy in the same sector – in this case the tech-industry- may be taking a long position in Nvidia and offsetting that by taking a short position in Intel. If an investor bought 1000 shares of Nvidia at $250 each, the short side of such a trade would involve short selling 5000 shares of Intel at $50 each, if the investor wanted to keep both sides equal in dollar value.
The ideal scenario would be Nvidia appreciating and Intel depreciating in value. If hypothetically the price of Nvidia increased to $270 and Intel dropped to $49, the overall profit would be $25,000. Even if Intel appreciated to $52 while Nvidia also appreciated to $270, the overall profit would still be $10,000.
Long/short investment in different sectors, which is a more common form of this strategy, can be done when the shares in a single sector tend to move higher or lower in unison and investors try to identify overperforming and underperforming sectors in a certain macroeconomic situation (Cyclical Vs. Non-Cyclical Sectors). Another simplified example of long/short investment in different sectors as per the tables below would be going long in Utilities-Energy assets such as Oil Well Equipment and shorting the Construction sector assets such as Construction Services.
Overperforming
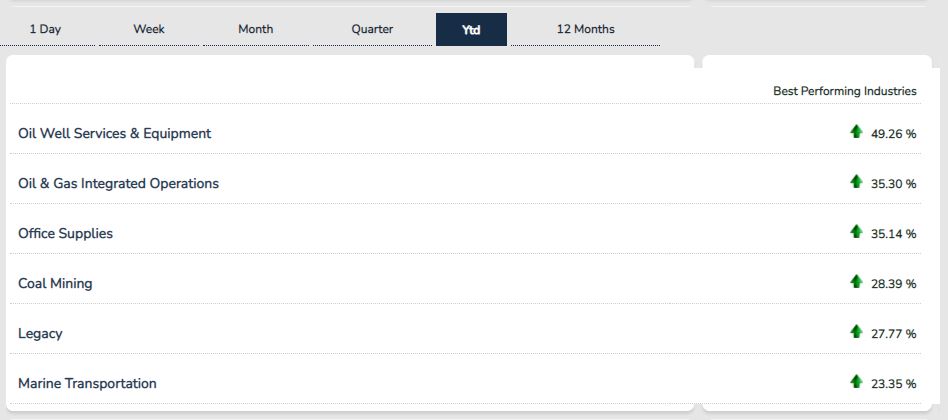
Underperforming
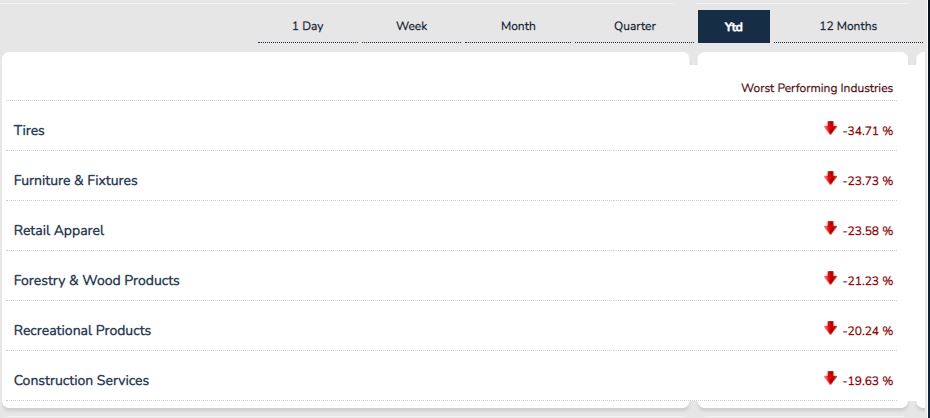
Images source – csimarket.com
A long-short strategy has both pros and cons to consider. Among the pros one should include that balancing among long and short positions can prove to be a good way to mitigate risk and gain from an increase in a down-market, but keep in mind that no strategy can eliminate all risk. Among the cons to consider is that shorting – especially shares – is more costly due to fees involved that can affect bottom line profits. It is up to the individual investor to research and choose the best long-short strategy they think would work best for them.
Sources
smartasset.com, morganstanley.com, wallstreetprep.com, investopedia.com, thebalance.com, guggenheiminvestments.com, blackrock.com, vanguard.com, sec.gov.
*Disclaimer: The information contained in this publication does not constitute investment advice and is not a personal recommendation from NaxexInvest. Nothing contained herein constitutes the solicitation of the purchase or sale of type of financial instrument. Any investment activities undertaken using this information will be at the sole risk of the relevant investor. NaxexInvest expressly disclaims all liability for the use or interpretation (whether by visitor or by others) of information contained herein. Decisions based on this information are the sole responsibility of the relevant investor. Any visitor to this page agrees to hold NaxexInvest and its affiliates and licensors harmless against any claims for damages arising from any decisions that the visitor makes based on such information.
April 4th, 2022 by Nikolay Alexandrov
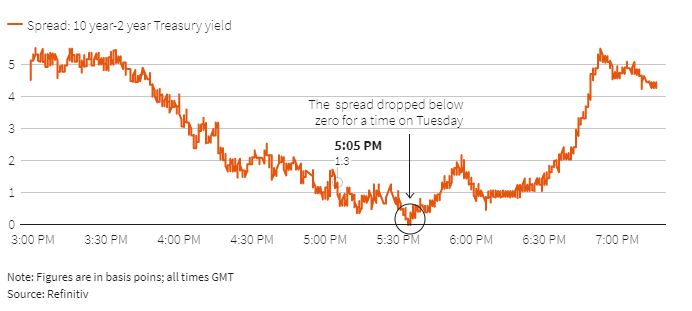
Since World War II every yield curve inversion was followed by a recession in the following 6-18 months, and recessions are naturally correlated with decreased stock market returns. When the return of the 10-Year note is lower than the 2-Year note, that points to a negative outlook in investor confidence and a reluctance from them to commit their money in a risk-on scenario.
The US Treasury issues debt in maturities of 1, 2, 3, 6 and 12 months (T-bills) – and 2, 3, 5, 7, 10 years (T-notes) — and 20, and 30 years (T-bonds). These are issued bonds just like any other. For example, if you bought $1,000 of the 10-year bond with interest rate at 2%, then you pay $1,000 today, receive $20 every year at the end of years 1-9, and you receive $1,020 (representing $20 interest + your original $1,000) at the end of year 10.
The Federal Funds rate (Fed rate) is the target rate set by the US Federal Reserve and it is the interest rate that banks use to lend/borrow from the Federal Reserve overnight. Since the fed funds rate is the rate at which you can lend cash to the US Government overnight, this rate serves as the foundation of the yield curve. It is the same as a US Treasury bond with a 1-day maturity. When the Federal Reserve proceeds to change this rate, all other rates adjust accordingly as well.
On Tuesday March 29, Bloomberg data showed the 10-Year US Treasury note yield briefly crossing below the 2-Year US treasury note yield. The last time this type of inversion happened was in September 2019. Market participants who closely watch the yields are concerned that the economy maybe headed into a recession.
While the inversion around September 2019 was followed by a sharp market drop in 2020, nobody could foresee the closure of businesses and economic downturn that Covid-19 brought about. The concern this time is different. There is a sense by some analysts that the Federal Reserve might hinder further economic growth if it aggressively seeks to hike rates in order to fight increased inflationary tendencies. After all, prices are rising at their fastest pace in 40 years. The latest CPI figures confirm these tendencies.
On the other hand, there is another group of economic analysts that argue that the inversion is different this time. One argument to support this case is that there is increased and unprecedented intervention by global governments into bond markets. Fed intervention may have distorted by the massive bond purchases that may be holding down longer dated yields compared to the shorter dated ones. It is also sometimes argued that 2-year/10-year yields are not the most useful ones to watch, and that instead one should focus on shorter duration yields, such as the 3-month treasuries.
Yield curves are 90 percent of the time ‘normal’ with longer-term rates exceeding short-term rates. On those few occasions when they are inverted, it is almost always bad news. A short-lived inversion of the yield curve may not be a clear indicator of an imminent recession and maybe it’s too early to say. However, the market is sending signals that some form of change is coming and we can only find out what it means in hindsight rather than at the present time.
Sources
currentmarketvaluation.com, edition.cnn.com, finance.yahoo.com, reuters.com, , theconversation.com, stlouisfed.org
*Disclaimer: The information contained in this publication does not constitute investment advice and is not a personal recommendation from NaxexInvest. Nothing contained herein constitutes the solicitation of the purchase or sale of type of financial instrument. Any investment activities undertaken using this information will be at the sole risk of the relevant investor. NaxexInvest expressly disclaims all liability for the use or interpretation (whether by visitor or by others) of information contained herein. Decisions based on this information are the sole responsibility of the relevant investor. Any visitor to this page agrees to hold NaxexInvest and its affiliates and licensors harmless against any claims for damages arising from any decisions that the visitor makes based on such information.
March 29th, 2022 by Nikolay Alexandrov
Many manufacturers across many industries are faced with an unprecedented global shortage of tech parts such as semiconductors and sensors. The Covid-19 pandemic, the higher demand than supply and the more recent political sanctions have all contributed to these shortages that impacted among others the automobile industry, game console manufacturers and the almighty – seemingly unstoppable – smartphone manufacturers. What are the implications of these global chip shortages?
During the Covid-19 pandemic many production line workers had to stay home due to lockdowns and were unavailable sometimes for several months. By the time lockdowns were lifted, the rising demand for consumer and business electronics disrupted the supply chain. Up until recently, the numbers of returning employees was limited due to social distancing restrictions that did not allow production lines to work at full capacity.
Before the events took place in Ukraine, the US Commerce Department had published a semiconductor supply chain report that projected the worldwide chip shortage to last until the end of 2022, and possibly even extend into 2023.
More recently, the beginning of the geopolitical conflict between Russia and Ukraine seems likely to add to the chip shortage woes. Palladium and neon are two key resources for the production of semiconductors. According to a Moody’s Analytics estimate, Russia supplies approximately 40 per cent of the world’s supply of palladium and Ukraine produces about 70 per cent of the world supply of neon. Thus, these chip shortages are expected to worsen if the conflict drags on for a long period of time.
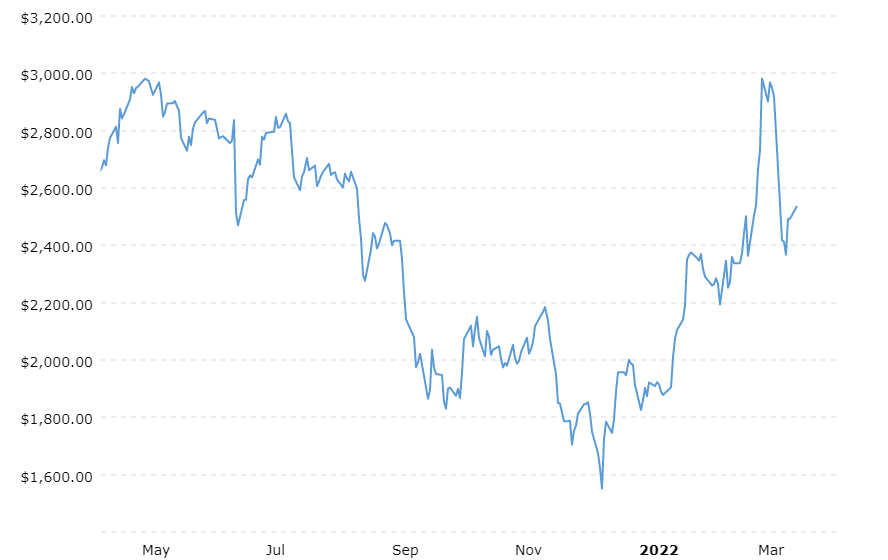
Palladium Prices – source: macrotrends.net
According to the U.S. department of Commerce, on Monday March 21st, security officials from both political parties urged Congress to fast-track a legislation for “revitalizing domestic semiconductor manufacturing, boosting domestic manufacturing, and helping America economically outcompete China and the rest of the world in the 21st century”.
The EU is prioritizing similar policies with the European Chips Act. If this act is adopted, there will be a funding of €43 billion in public and private investments to grow the EU’s semiconductor global market share to 20 percent by 2030.
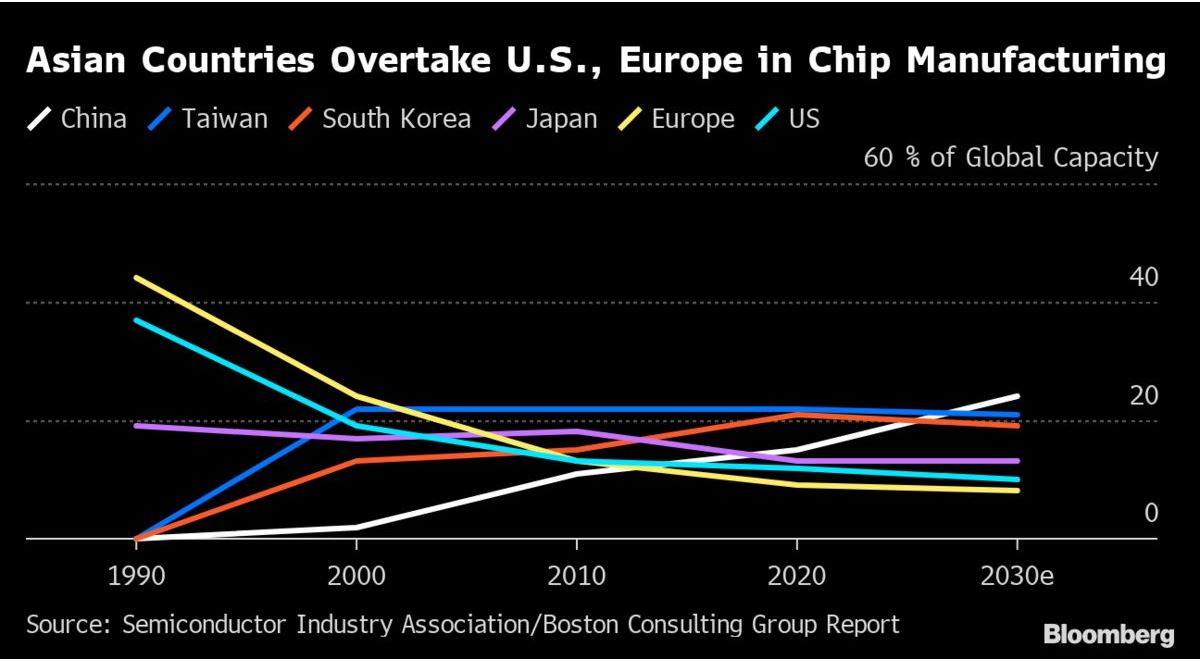
Predictions of when the shortages will come to an end vary, with most suggesting challenges will persist until at least late this year. Over the last three decades, companies took advantage of reliable, low-cost transportation and a favorable trading environment with low-cost labor in Asia to deliver cheaper products. This last three decades environment of far-reaching global supply chains is probably over. There will still be trade growth between nations, however, the focus currently seems to be towards self-sufficiency in all the goods and materials consumed by modern economies.
Sources
pinterest.com, fierceelectronics.com, forbes.com, community.fs.com, petapixel.com, business-standard.com, macrotrends.net, commerce.gov, rideapart.com, bloombergquint.com, hbr.org.
*Disclaimer: The information contained in this publication does not constitute investment advice and is not a personal recommendation from NaxexInvest. Nothing contained herein constitutes the solicitation of the purchase or sale of type of financial instrument. Any investment activities undertaken using this information will be at the sole risk of the relevant investor. NaxexInvest expressly disclaims all liability for the use or interpretation (whether by visitor or by others) of information contained herein. Decisions based on this information are the sole responsibility of the relevant investor. Any visitor to this page agrees to hold NaxexInvest and its affiliates and licensors harmless against any claims for damages arising from any decisions that the visitor makes based on such information.
March 28th, 2022 by Nikolay Alexandrov
There is an ongoing debate in the financial world regarding stock splits. On one hand, you have big investors like Warren Buffett who hate stock splits, and on the other hand, previous stock splits like Amazon’s splits in the late 90’s make the case against this notion.
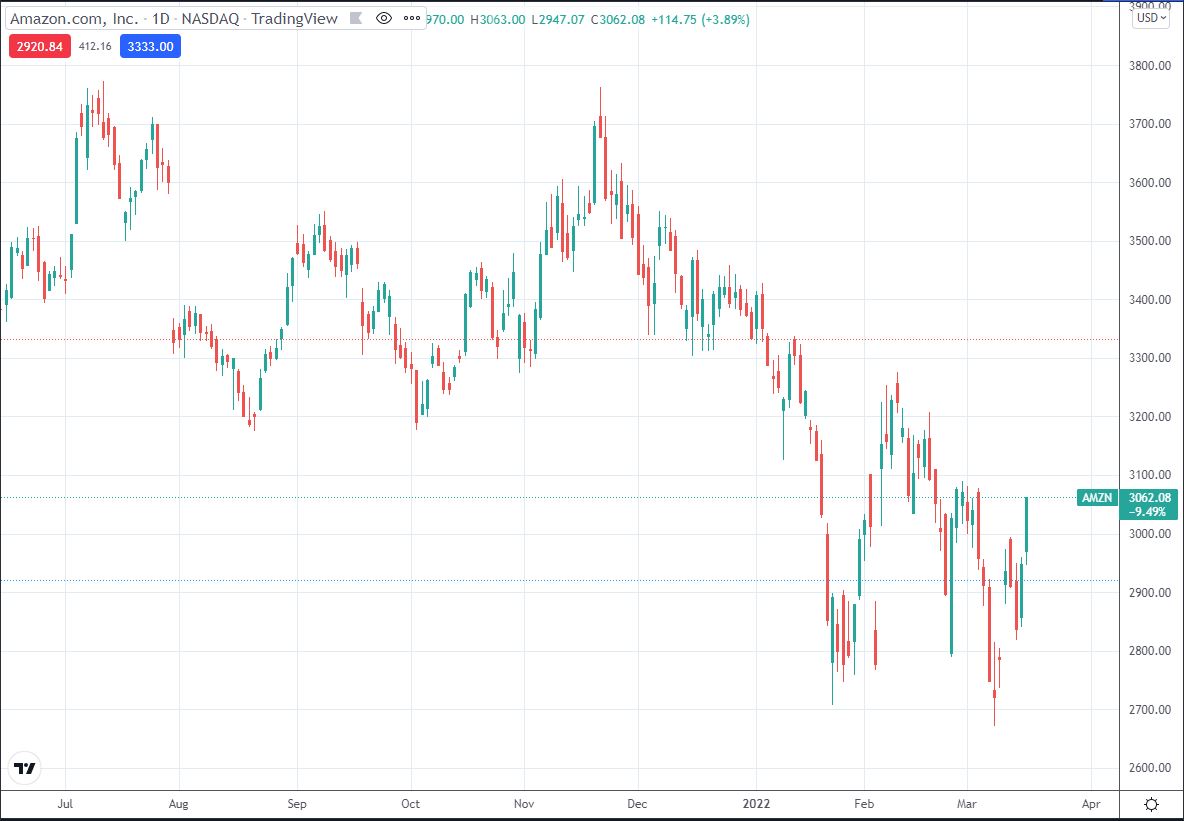
In the late ’90s, Amazon executed three splits in quick succession, beginning with a 2-for-1 split in in 1998, when the shares were worth about $86 a piece. Amazon has grown quite a bit since then. As of March 10th, one share of its stock is worth $2,933. That means your original $860 investment would now be worth about $351,960 today.
Since the start of the Covid-19 pandemic, Wall Street experienced a massive inflow of retail investors. At the same time as this inflow occurred, tech-stocks rose at high speeds in a short period of time. Apple and Tesla split 4-for-1 and 5-for-1 respectively on the same date, August 2020. Chip maker Nvidia followed suit with a 4-for-1 split in July 2021.
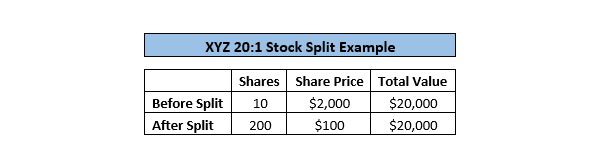
Alphabet, the parent company of Google, announced a 20-for-1 stock split along with its quarterly earnings report on February 1st 2022. Not too long after that announcement, on Thursday 10th March 2022, Amazon stock shot higher in after-hours trading on some big news saying that the company’s Board of directors is going to enact a 20-to-1 split, just like Alphabet.
AMAZON
ALPHABET
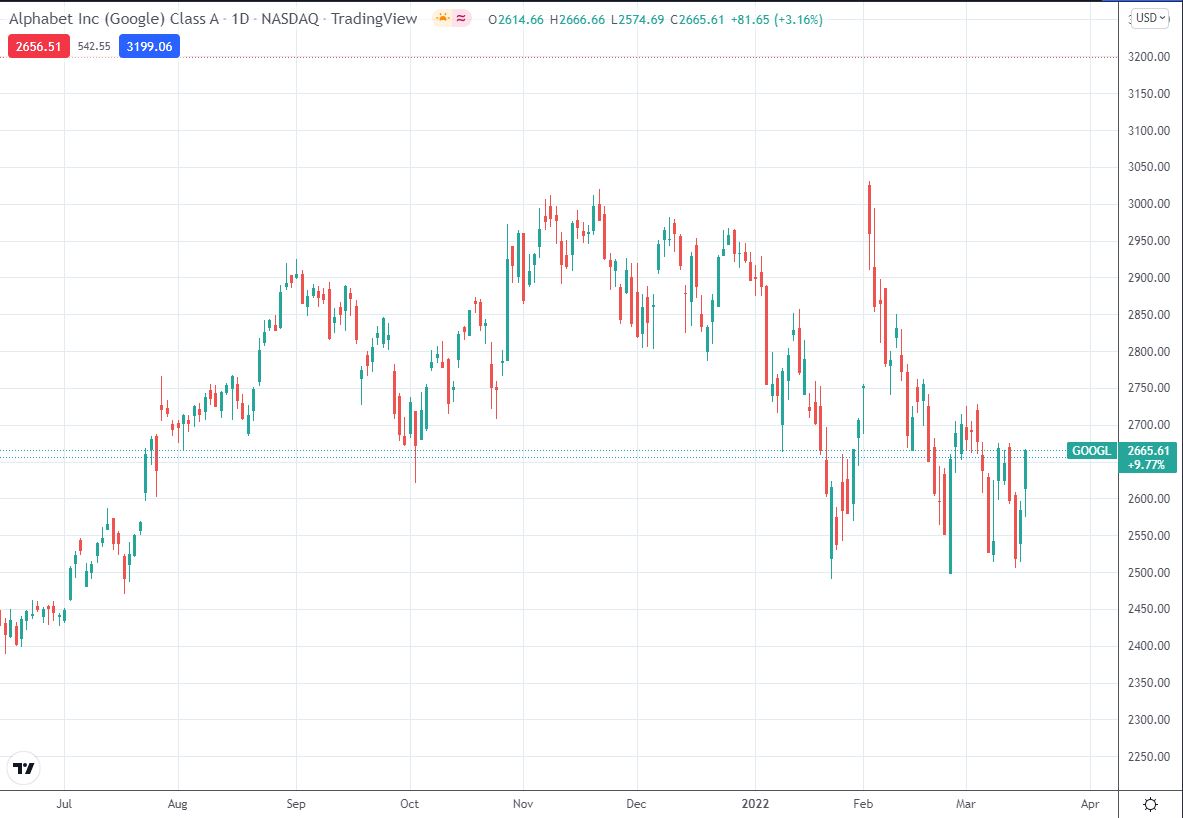
For Amazon (AMZN) shareholders the close of business on May 27th 2022 is the “record date”, meaning that the split will take place on June 3, while the trading on a split-adjusted basis (20-for-1)) will happen on the 6th of June. Please note that if you buy AMZN shares after the record date, you will not be “on record” for the split adjustment, implying that your AMZN shares will not be subject to the stock-split. Consecutively, for Alphabet (GOOGL)stockholders the “record date” is set on July 1st 2022, the split-adjusted basis will happen on Friday July 15th and the trading on the split-adjusted basis (20-for-1) will commence on July 18th. Both corporate actions (stock splits) require prior shareholder approval.
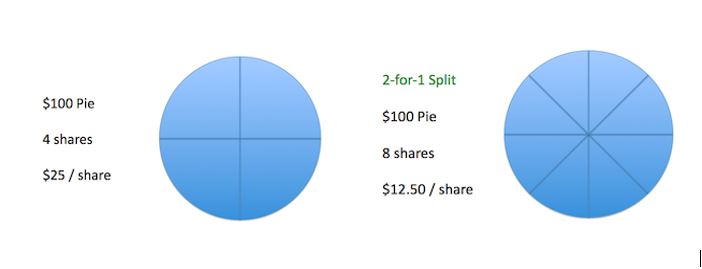
What is actually a stock split and what are the potential benefits from splitting a stock? A stock split is a decision by a company’s board of directors to increase the number of shares outstanding by issuing more shares to current shareholders.
The “pie” example explains a stock split in a simple way. The pie represents the entire company. Each share is a slice of the pie. A stock split is the act where the company takes each slice of the pie and cuts it into even smaller pieces. The pie is still the same size, it just has more smaller size pieces.
The case made for stock splits is that it makes it more attractive and affordable to retail investors. Many small beginning investors start investing in smaller amounts. A lot of them could possibly afford one single stock of these companies at current prices, or even just a fraction of those shares with their current investment budget. Another reason is that it makes it easier to manage portfolios, by allowing flexible rebalancing of positions by selling a portion of a holding in a single share, if the price is smaller. A high per-share price makes it more difficult as it may take out a lager chunk of the entire portfolio in a case where rebalancing is required. Finally, stock splits such as Apple, Nvidia and Tesla have shown a tendency to outperform the market shortly afterwards, which makes the case that stock splits usually help companies to grow their market cap.
The debate for stock splits will always be present and only time will tell what the success rate of Alphabet and Amazon splits will be for investors this time around.
Sources
reuters.com, forbes.com, qz.com, seekingalpha.com, fool.com, thestreet.com, investorplace.com, coronadotimes.com, grow.acorns.com, tradingview.com .
*Disclaimer: The information contained in this publication does not constitute investment advice and is not a personal recommendation from NaxexInvest. Nothing contained herein constitutes the solicitation of the purchase or sale of type of financial instrument. Any investment activities undertaken using this information will be at the sole risk of the relevant investor. NaxexInvest expressly disclaims all liability for the use or interpretation (whether by visitor or by others) of information contained herein. Decisions based on this information are the sole responsibility of the relevant investor. Any visitor to this page agrees to hold NaxexInvest and its affiliates and licensors harmless against any claims for damages arising from any decisions that the visitor makes based on such information.